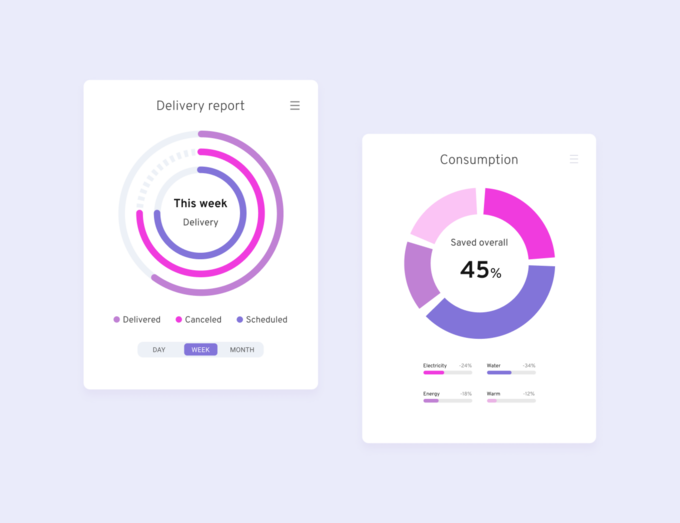
Consumption and Delivery report Pie charts

Colorful diagram for the report. Circle infographic for presentation. Templates for creating visualized presentations. Figma files included.
Features:
Statistic App Screens
Unique, Stylish & Modern Design
Fully customizable
Scalable Vector & Free Fonts
Compatible with Figma.
File size: 1.72 MB
More like this


Showcase yourself, sell your goods, services or find creators, experts from the World
- Digital products
- Freelance Services
- Accept Donations
- Hire Experts
Subscription
$
18
$
/ mo billed annually
$1.2 per template
- Vector in high-resolution
- Access to 1,248 premium vectors templates
- 10 downloads per month
- Regular updates
Template purchase
Downloads any type of assets from largest collection of templates including graphic, Instagram templates, landing page, logo, presentations, UI & dashboards, UI kits (web blocks). Get latest updates and trending design resources.